
Neuroimaging data is often stored in the format of nifti files .nii which can also be compressed using gzip .nii.gz. These files store both 3D and 4D data and also contain structured metadata in the image header.
There is an very nice tool to access nifti data stored on your file system in python called nibabel. If you don't already have nibabel installed on your computer it is easy via pip. First, tell the jupyter cell that you would like to access the unix system outside of the notebook and then install nibabel using pip. You only need to run this once (unless you would like to update the version).
!pip install nibabel
nibabel objects can be initialized by simply pointing to a nifti file even if it is compressed through gzip. First, we will import the nibabel module as nib (short and sweet so that we don't have to type so much when using the tool).
import os
import numpy as np

%matplotlib inline
import matplotlib.pyplot as plt

import nibabel as nib
data = nib.load('./brain.nii.gz')
data.get_fdata().shape
If we want to get more help on how to work with the nibabel data object we can either consult the documentation or add a ?.
data?
The imaging data is stored in either a 3D or 4D numpy array. Just like numpy, it is easy to get the dimensions of the data using shape
data.shape
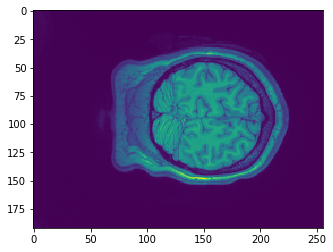
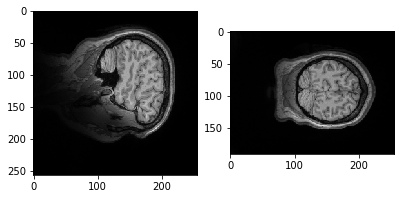
plt.imshow(data.get_fdata()[:,50,:])
Let's try a different slice.
plt.imshow(data.get_fdata()[:,:,10])
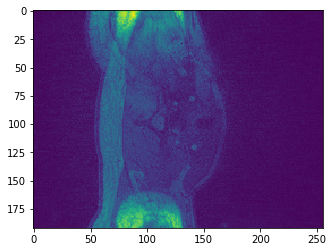
Why is it it doesn't look like a brain at all? What do you think it is showing?
Try slicing different dimensions (x,y,z) yourself to get a feel for how the data is represented in this anatomical image.
Mask
As you probably already notice, many of slices do not show brain at all! There are several techniques to determine whether a voxel belongs to the brain part or not. Using those techniques, we can obtain a mask, which is simply a 3D-array of 0's and 1's, where 1 tells you that that location is brain and 0 tells you the otherwise.
One way to use the mask is to superimprose it on a brain image to add highlights only the brain part that we care about.
Let's load a pre-computed mask image.
mask = nib.load('./mask.nii.gz')
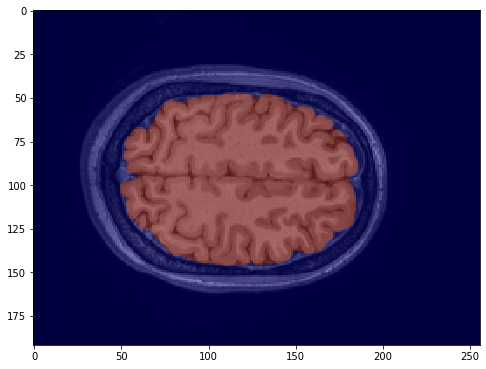
Using matplotlib's imshow, we can superimpose the mask as a semi-transparent layer to highlight the brain.
plt.figure(figsize=(8, 8))
plt.imshow(data.get_fdata()[:,:,200], 'gray', interpolation='none')
plt.imshow(mask.get_fdata()[:,:,200], 'jet', alpha=0.5, interpolation='none')
plt.show()
Try slicing different dimensions (x,y,z) yourself to get a feel for how the data is represented in this anatomical image.
Exercises
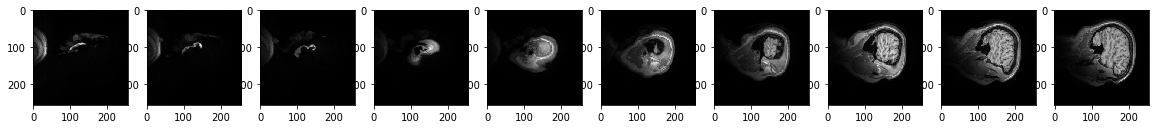
Visualize slices across an axis
The function below contains skeleton code that is hardcoded to show 10 slices of brain images across the x axis, 5 slices apart.
TODO: Implement the following functionalities
- handle axis = 'y' or 'z', and anywhere from 1 to 30 slices.
- handle numbOfSlices from 1 to 20
- handle steps
- show the value on the plot, e.g., adding a label x=20 on the slice where x=20
# TODO:
def ShowSlicesAcrossAxis(data, axis, numberOfSlices, steps):
    if axis == 'x':
        plt.figure(figsize=(20, 20))
        for i in [1,2,3,4,5,6,7,8,9,10]:
            plt.subplot(1,10,i)
            plt.imshow(data.get_fdata()[i*5,:,:], 'gray', interpolation='none')
        plt.show()
ShowSlicesAcrossAxis(data, 'x', 5, 1)
# this should show five brain slices along the z-axis that are 15 slices apart
ShowSlicesAcrossAxis(data, 'z', 20, 15)
# this should show two brain slices along the y-axis that are 10 slices apart
ShowSlicesAcrossAxis(data, 'y', 10, 10)
Visualize at the (x,y,z) location
A typical way to visualize a location is:
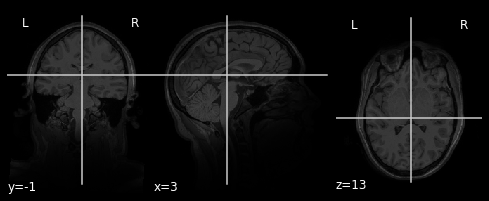
Your task is to improve this code so that it can generate a visualization like above. The code below provides a partial implemention.
At very least, you will need to add the following functionalities:
- interpret x, y, z relative to the center of the data (e.g., x=1 -> x=-25 if there are 50 slices along x)
- add labels showing the values of x, y, z
- add crosses
- check for boundaries
def ShowLocation(data, x, y, z):
    plt.figure(figsize=(10,10))
    plt.subplot(1,3,1)
    plt.imshow(data.get_fdata()[50,:,:], 'gray', interpolation='none')
    plt.subplot(1,3,2)
    plt.imshow(data.get_fdata()[:,50,:], 'gray', interpolation='none')
    plt.show()
ShowLocation(data, 0, 0, 0)

ShowLocation(data, -5, 5, 5)

def ShowLocationWithMask(data, x, y, z, mask):
    plt.figure(figsize=(10, 10))
    plt.subplot(1,3,1)
    plt.imshow(data.get_fdata()[50,:,:], 'gray', interpolation='none')
    plt.subplot(1,3,2)
    plt.imshow(data.get_fdata()[:,50,:], 'gray', interpolation='none')
    plt.show()
ShowLocationWithMask(data, 0, 0, 0, mask)
ShowLocationWithMask(data, 0, 0, 0, mask)
